Earthquake Monitor
Arthur's Pass National Park covers rugged mountainous terrain between the Waimakariri and Taramakau river valleys. Arthur's Pass Village lies close to the Alpine Fault and many other faultlines, it is frequently shaken by earthquakes. Many of these are small, and go un-noticed by the locals, but visitors may be startled by shakes over magnitude 2. If a shake is strong & long, DROP, COVER, HOLD; once a severe earthquake ceases the Village Civil Defense procedures will kick-in - look after yourself and neighbours!
Rock falls and fault scarps in the Arthur's Pass landforms are evidence that the area is in an active earthquake zone.
We acknowledge the New Zealand GeoNet project and its sponsors EQC, GNS Science and LINZ, for providing data/images used in this site. The "recent earthquake" database used to update information in this site is generally revised 1 min to 15 mins after an event.
Last Earthquakes (Arthur's Pass - Mt Cook Area)
Most recent quake Magnitude 2, Sat, Feb 14 2026 at 8:39:15 pm (NZST), 55 km south of Hokitika
For detail information visit www.geonet.org.nz.
Largest most recent quake
 Magnitude 3.9, Tue, Dec 09 2025 at 2:27:03 am (NZST), 30 km west of Hokitika
For detail information visit www.geonet.org.nz.
Last Earthquakes (New Zealand)
Most recent NZ quake Magnitude 2, Feb 14 2026 at 8:39:15 pm (NZST), 55 km south of Hokitika
For detail information visit www.geonet.org.nz.
Largest most recent quake
 Magnitude 3.7, Feb 14 2026 at 2:32:56 pm (NZST), 5 km north-west of Westport
For detail information visit www.geonet.org.nz.
Recent Earthquakes x31 (Last 15 days .. Arthur's Pass to Mt Cook Area)
 Magnitude 2, Sat, Feb 14 2026 at 8:39:15 pm (NZST), 55 km south of Hokitika
For detail information visit www.geonet.org.nz.
 Magnitude 1.8, Fri, Feb 13 2026 at 9:28:34 am (NZST), 15 km north-east of Arthur's Pass
For detail information visit www.geonet.org.nz.
 Magnitude 1.8, Thu, Feb 12 2026 at 7:51:26 pm (NZST), 60 km north-east of Mount Cook
For detail information visit www.geonet.org.nz.
 Magnitude 1.9, Wed, Feb 11 2026 at 7:03:14 pm (NZST), 45 km north-east of Arthur's Pass
For detail information visit www.geonet.org.nz.
 Magnitude 2.7, Wed, Feb 11 2026 at 11:37:37 am (NZST), 20 km north of Arthur's Pass
For detail information visit www.geonet.org.nz.
 Magnitude 2, Wed, Feb 11 2026 at 11:24:21 am (NZST), 15 km north-west of Oxford
For detail information visit www.geonet.org.nz.
 Magnitude 0.9, Wed, Feb 11 2026 at 10:55:52 am (NZST), 30 km east of Mount Cook
For detail information visit www.geonet.org.nz.
 Magnitude 1.1, Tue, Feb 10 2026 at 10:28:12 pm (NZST), 45 km north-east of Arthur's Pass
For detail information visit www.geonet.org.nz.
 Magnitude 1.7, Tue, Feb 10 2026 at 5:44:09 pm (NZST), 35 km north-east of Mount Cook
For detail information visit www.geonet.org.nz.
 Magnitude 1.6, Tue, Feb 10 2026 at 1:01:22 pm (NZST), 15 km north-east of Greymouth
For detail information visit www.geonet.org.nz.
 Magnitude 2, Tue, Feb 10 2026 at 12:19:13 pm (NZST), 45 km south of Hokitika
For detail information visit www.geonet.org.nz.
 Magnitude 1.8, Tue, Feb 10 2026 at 7:21:04 am (NZST), 65 km north-east of Mount Cook
For detail information visit www.geonet.org.nz.
 Magnitude 2, Mon, Feb 09 2026 at 7:59:09 am (NZST), 15 km north-west of Oxford
For detail information visit www.geonet.org.nz.
 Magnitude 2, Sat, Feb 07 2026 at 8:42:28 pm (NZST), 20 km north of Arthur's Pass
For detail information visit www.geonet.org.nz.
 Magnitude 1.5, Sat, Feb 07 2026 at 1:59:17 am (NZST), 10 km south of Methven
For detail information visit www.geonet.org.nz.
 Magnitude 1.7, Fri, Feb 06 2026 at 4:03:31 pm (NZST), 35 km north-west of Methven
For detail information visit www.geonet.org.nz.
 Magnitude 1.5, Fri, Feb 06 2026 at 8:48:54 am (NZST), 50 km south of Hokitika
For detail information visit www.geonet.org.nz.
 Magnitude 1.7, Fri, Feb 06 2026 at 4:02:52 am (NZST), 25 km north-west of Oxford
For detail information visit www.geonet.org.nz.
 Magnitude 1.7, Fri, Feb 06 2026 at 1:07:45 am (NZST), 35 km east of Mount Cook
For detail information visit www.geonet.org.nz.
 Magnitude 2.3, Thu, Feb 05 2026 at 8:37:31 pm (NZST), 5 km north-east of Oxford
For detail information visit www.geonet.org.nz.
 Magnitude 2.3, Thu, Feb 05 2026 at 2:37:22 pm (NZST), 25 km east of Arthur's Pass
For detail information visit www.geonet.org.nz.
 Magnitude 1.7, Wed, Feb 04 2026 at 6:14:55 pm (NZST), 35 km north-west of Methven
For detail information visit www.geonet.org.nz.
 Magnitude 2, Wed, Feb 04 2026 at 5:59:55 pm (NZST), 15 km north-west of Oxford
For detail information visit www.geonet.org.nz.
 Magnitude 1.6, Tue, Feb 03 2026 at 11:02:45 pm (NZST), 45 km north-east of Arthur's Pass
For detail information visit www.geonet.org.nz.
 Magnitude 1.9, Tue, Feb 03 2026 at 7:20:09 pm (NZST), 40 km east of Mount Cook
For detail information visit www.geonet.org.nz.
 Magnitude 1.7, Tue, Feb 03 2026 at 2:34:52 am (NZST), 20 km south of Arthur's Pass
For detail information visit www.geonet.org.nz.
 Magnitude 1.7, Sun, Feb 01 2026 at 7:49:44 am (NZST), 25 km north-west of Oxford
For detail information visit www.geonet.org.nz.
 Magnitude 3.1, Sun, Feb 01 2026 at 5:23:39 am (NZST), 35 km south-west of Twizel
For detail information visit www.geonet.org.nz.
 Magnitude 2.8, Sat, Jan 31 2026 at 9:33:46 pm (NZST), 40 km east of Mount Cook
For detail information visit www.geonet.org.nz.
 Magnitude 1.8, Sat, Jan 31 2026 at 11:17:48 am (NZST), 20 km north-west of Arthur's Pass
For detail information visit www.geonet.org.nz.
 Magnitude 2.1, Sat, Jan 31 2026 at 12:07:46 am (NZST), 45 km east of Arthur's Pass
For detail information visit www.geonet.org.nz.
Reading Seismic Drum Data
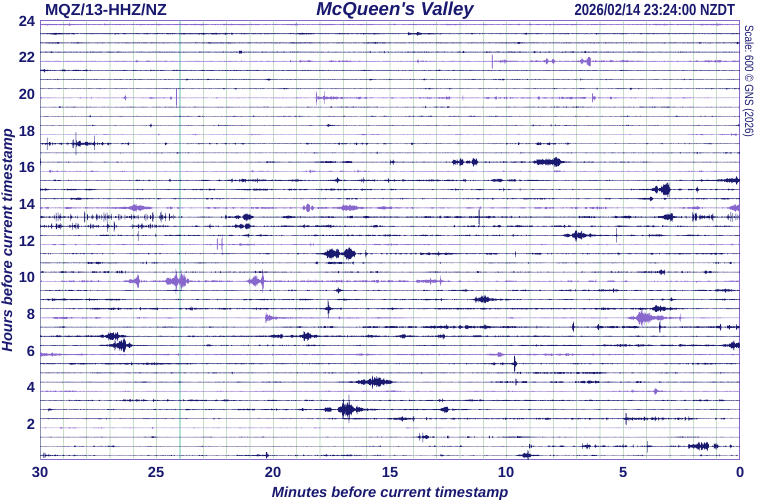
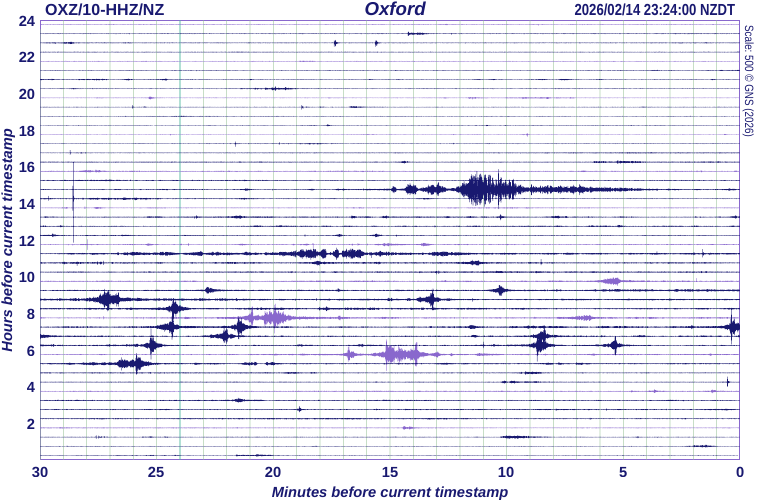
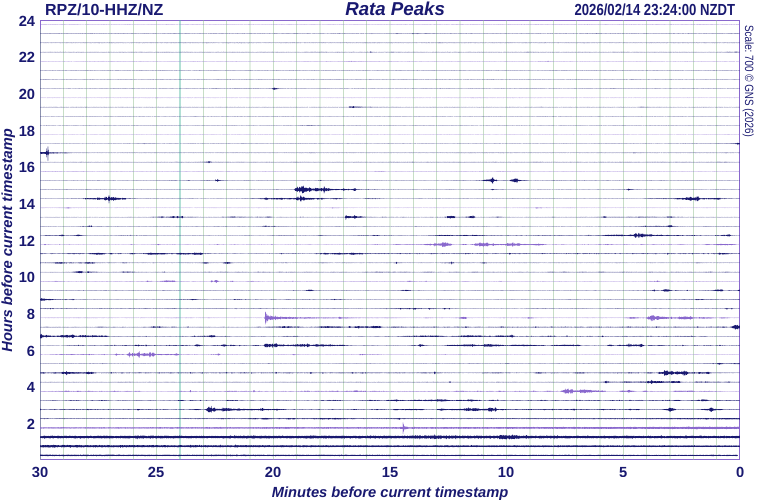
The timestamp shown at the top right of the seismograph drum shown below is the time when this image was last refreshed. Each horizontal line (or trace) represents 30 minutes, each vertical line is spaced 1 minute apart; 24 hours of recording are displayed in total. The most recent signal is drawn at the bottom right hand corner of the drum. Then read the traces from right to left, bottom to top, to get from the most recent to the oldest signals. The trace will appear red if the signals are very large; this means they have been clipped to stop them overwriting too much of the surrounding image. This image is updated every 10 minutes.
Seismic Drum - McQueens Valley - Banks Peninsula, Canterbury

Seismic Drum - Oxford, Canterbury

Seismic Drum - Rata Peaks Station - behind Ashburton, Canterbury

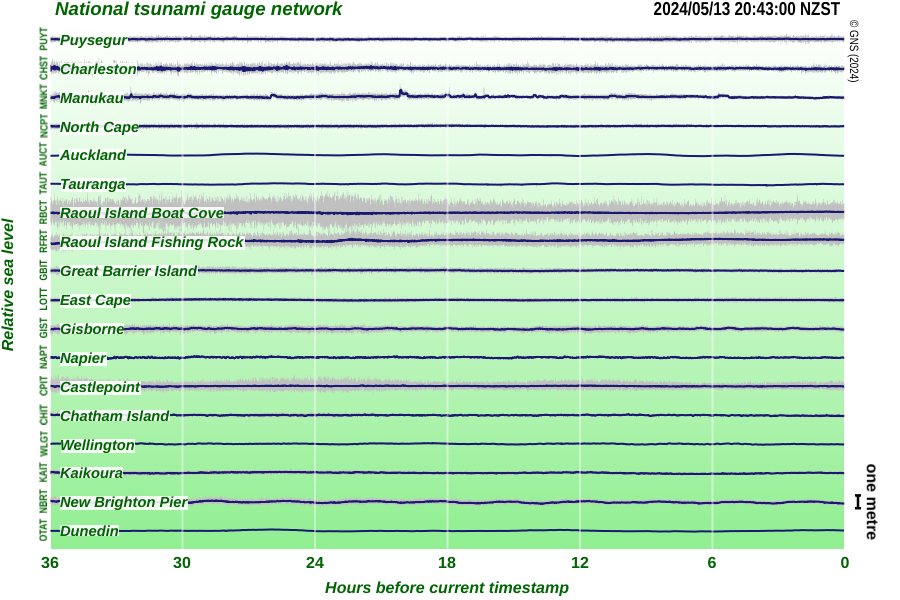
New Zealand Tsunami Guage Network (detided)
The timestamp shown at the top right of the diagram below is the time when the images were last refreshed. The previous 36 hours of sea level variations from all operational sites are displayed, oldest to most recent from left to right. Within the sampling period of one minute, the dark part of the trace shows the average sea level height, whilst the grey part shows the maximum and minimum values.

 An earthquake is a sudden and massive fracturing and movement along a weakened area such as a fault line.
Earthquakes release energy in the form of shock waves. Shock waves travvel from the centre of the earthquake deep in the earth's crust (focus) either through the earth's interior or along its surface. The point at the surface vertically above the "focus", is known as the "epicentre".
Major Earthquake Events Around Arthur's Pass
- 1929 (6.3 R/S) :
- Triggered 60 million cubic metres of greywacke rock to collapse off the aptly named Falling Mountain and flow east at least 3 kilometres down the Otehake River valley.
- June 18th 1994 (6.5 R/S) :
- This earthquake caused numerous rockfalls in the area and some building damage in Arthur's Pass Village. The road over the Otira Gorge was closed for 4 days. A few huts in the backcountry were damaged, Greenlaw Hut being severely damaged. Near Carrington Hut an entire ridge fell off the Camp Spur between the Hut and the Clough Cableway. Beech forest was toppled near the epicentre. It was followed by two major aftershocks measuring 5.8 and 5.6 centred near Lake Coleridge.
- May 29th 1995 (5.5 R/S) :
- Rock already weakened from the year before caused a large landslide over the Main Highway. The Otira Road was closed for 5 days and further delays occurred when wet weather were initiated further slope failures. Several walking tracks were closed (Punchbowl Falls etc) due to constant rockfall hazard.
Faults & Folds
The upheavals created by plate movement and earthquakes put stresses on the earth's crust and deforms the rocks - either by folding or faulting.
Layers of rock - or strata can be moulded into many folds and examples of this can be seen throughout the Park. Faults occur where rocks have been weakened by stresses such as those caused by plate boundaries. This creates fault scarps, examples of which can be found on Kelly's Saddle near the Carroll Hut. There are many faults in the Arthur's Pass region. The Alpine Fault runs just 20 kilometres to the west of Arthur's Pass, crossing the Taramakau at Wainihinihi.
The Taramakau, which forms the northern boundary of the Park, flows east to west along the Hope Fault a major branch of the Alpine Fault. To the south are the Bruce and Harper faults.
The Alpine Fault
The Alpine Fault is said to be one of the few faults visible from space. Over 600 kilometres long in a virtually straight line from Milford Sound to Nelson, the fault dramatically marks the point where the India/Australian Plate overrides the Pacific Plate. The resulting collision has not only thrust up our alpine ranges but has ripped apart the crust, so that rocks that once lay side by side are now 450 kilometres apart. The Alpine Fault (PDF 2.11MB): This is a very thorough appendix to the West Coast Regional Council's Natural Hazards Resource Kit. Click Here to open online interactive fault mapping application.


WAINIHINIHI (AHNG) Geodetic Survey marker sits almost atop (1km - 1.5km to west of) the Alpine Fault on Highway 73 near Wainihinhi River and used to determine deformation movements. NZTM: E1464350 N5264031 H98.68m. The Alpine Fault stradles Highway 73 either side of the Taipo River bridge.
Mountain Building & Erosion
Vertical uplift over the past two million years has raised the rocks of the present park ranges by 18,000 metres (18 km). Most of the peaks now are between 1600m to 2400m in height, having had their much greater massif taken away by glaciation, erosion & weathering. Most of this material has been taken by the major river systems of the region, and been deposited as the huge Canterbury Plains, and the West Coast shelf.